This is how tour companies use TrekkSoft's suite of booking tools: a booking is made on their website via our booking widget, or made in-store and the booking information was entered in the back-end via our POS desk, back-end mobile app or the Admin desk.
Before the tour, guides are given a guest lists (or as we call them, manifests) that includes all the information about their guests. From outstanding payments (perhaps this booking was made with a 20% deposit and the remaining 80% was due on the day of the tour) to food allergies and special tour requests, guides have all the details at hand.
At the end of each month, an accountant at the company generates the monthly sales and turnover reports to balance their books. It is also common for business owners or sales teams to look through the data to analyse their performance—How did they do this month? Was there growth in booking numbers? Did the new marketing strategy work out? What about this new OTA they started working with, did this bring in the sales they were hoping for?
Managerial questions we want to answer with Business Intelligence
That's where the idea for a Business Intelligence tool came about—through back and forth emails, interviews and chats with our users. We found that the raw information our reports provided were not generating valuable and useful insights. While we could show that a company was bringing in 200 bookings a month, our reports didn't tell managers where these customers came from, how far in advance they booked, which activity out of the 200 bookings were most popular and so on.
We also found that our users wanted this information represented in a simpler form, something more visual, rather than the rows and columns that made up a majority of our reports.
So we got to work to produce the most requested tool and in March 2017, we released our Business Intelligence tool to give users a deeper understanding of their tours and activities.
Exploring Business Intelligence and the highly requested features
Everything in the tool was driven by conversations in the Community, from deciding on what information was valuable for managers to make smarter business decisions, to determining how to present the information in the Admin desk.
Over time, we developed different dashboards to give users multiple vantage points to analyse their sales and marketing performance.
Each dashboard comes with two important features: the Activity filter and the Date filter.
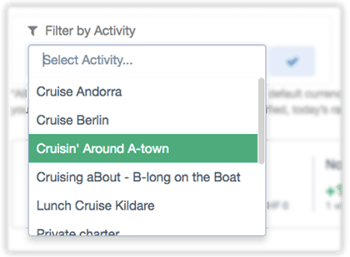
The Activity filter allows users to select one or multiple tours and/or activities to compare their performance or really dig deep into the performance of one activity over time. How often is this tour booked? Which customers tend to book this activity? How much revenue has this tour generated over time?
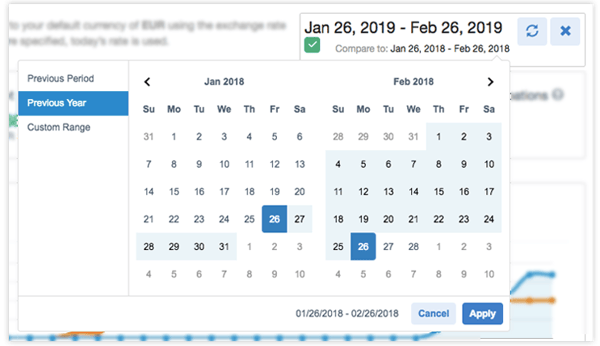
The Date filter allows users to set a date range to analyse performance, whether it's the past year, past period or a custom range. What's really cool here is that users can also compare performance from the past periods, years or select a custom range.
Business Intelligence Overview: An overview of sales and bookings for your tours and activities
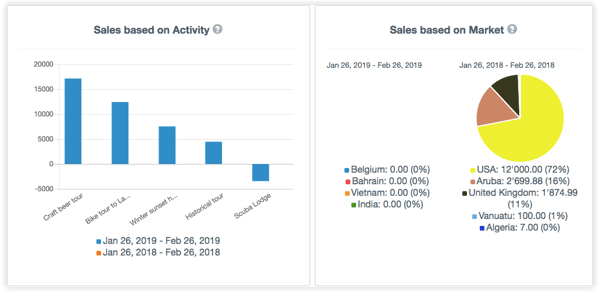
The overview is made up of four sections: a numerical dashboard, net sales, sales based on activity and sales based on market. All sections will show data based on the Activity and Date filters.


How companies use this feature:
A large walking tour company tracked the performance of their tours and activities over time. When they finally made the decision to list their tours on online travel agents (OTAs) like TripAdvisor Experiences, they used sales data and market data to decide which tour to list on which OTA.
Download your copy: Large marketplace comparison guide
Customer insights: Understand your market
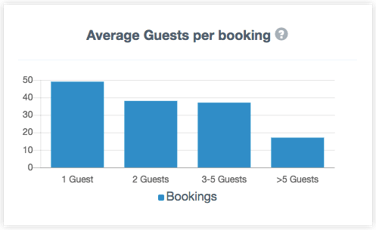
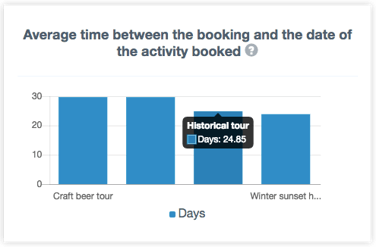
Here, along with a numerical dashboard, users will be able to answer questions like "What's the average number of guests per booking?" and "What's the average time between the booking and the date of the activity booked?", giving them unique insights into their customer base.
 How companies use this feature:
A boat tour company wanted to know how far in advance their tours were being bookings to better understand their customers' booking journey.
 Once they understood that many customers were making bookings months in advance, they began taking deposits to reduce no-shows on the day of the tour. It also help them better organise their crew and boats to meet the demands of customers.
Read more: The best way to measure growth of your tour company
Sales channel insights: Discover your most profitable channels
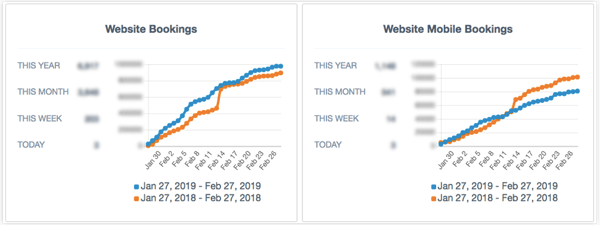
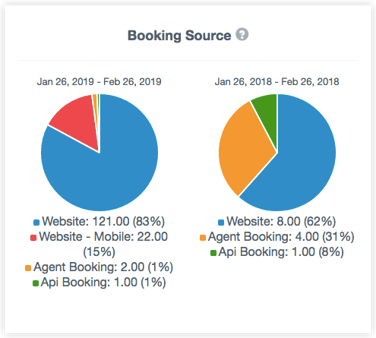
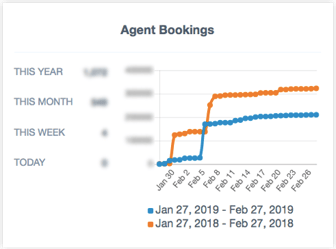
In this dashboard, users will be able to monitor and track the performance of different sales channels they've set up with TrekkSoft. You can not only get granular data on each sales channel, but also compare performance across time periods.
 How companies use this feature:
Growing companies appreciate the ability to compare year on year sales figures and understand where their bookings are coming from. Knowing where your bookings are coming from can help you decide what to invest more (or less) money and resources in.
Download your free Monthly Performance Report templates >>
Our users were the biggest influence in the design and development process
This tool was driven by our users. It was requested, voted on, and commented on. Our product managers then reached out to our user base to get more feedback and suggestions to drive the development process. Since the first dashboard was launched in March 2017, we've built two more dashboards and improved the overall design of the tool, again based on feedback from our users.
Need help finding a booking system for your tour company?
Note that Business Intelligence is only available with our Ultimate plan. Learn more about our price plans here.


