This is a collaborative post between myself and Stephanie Kutschera.
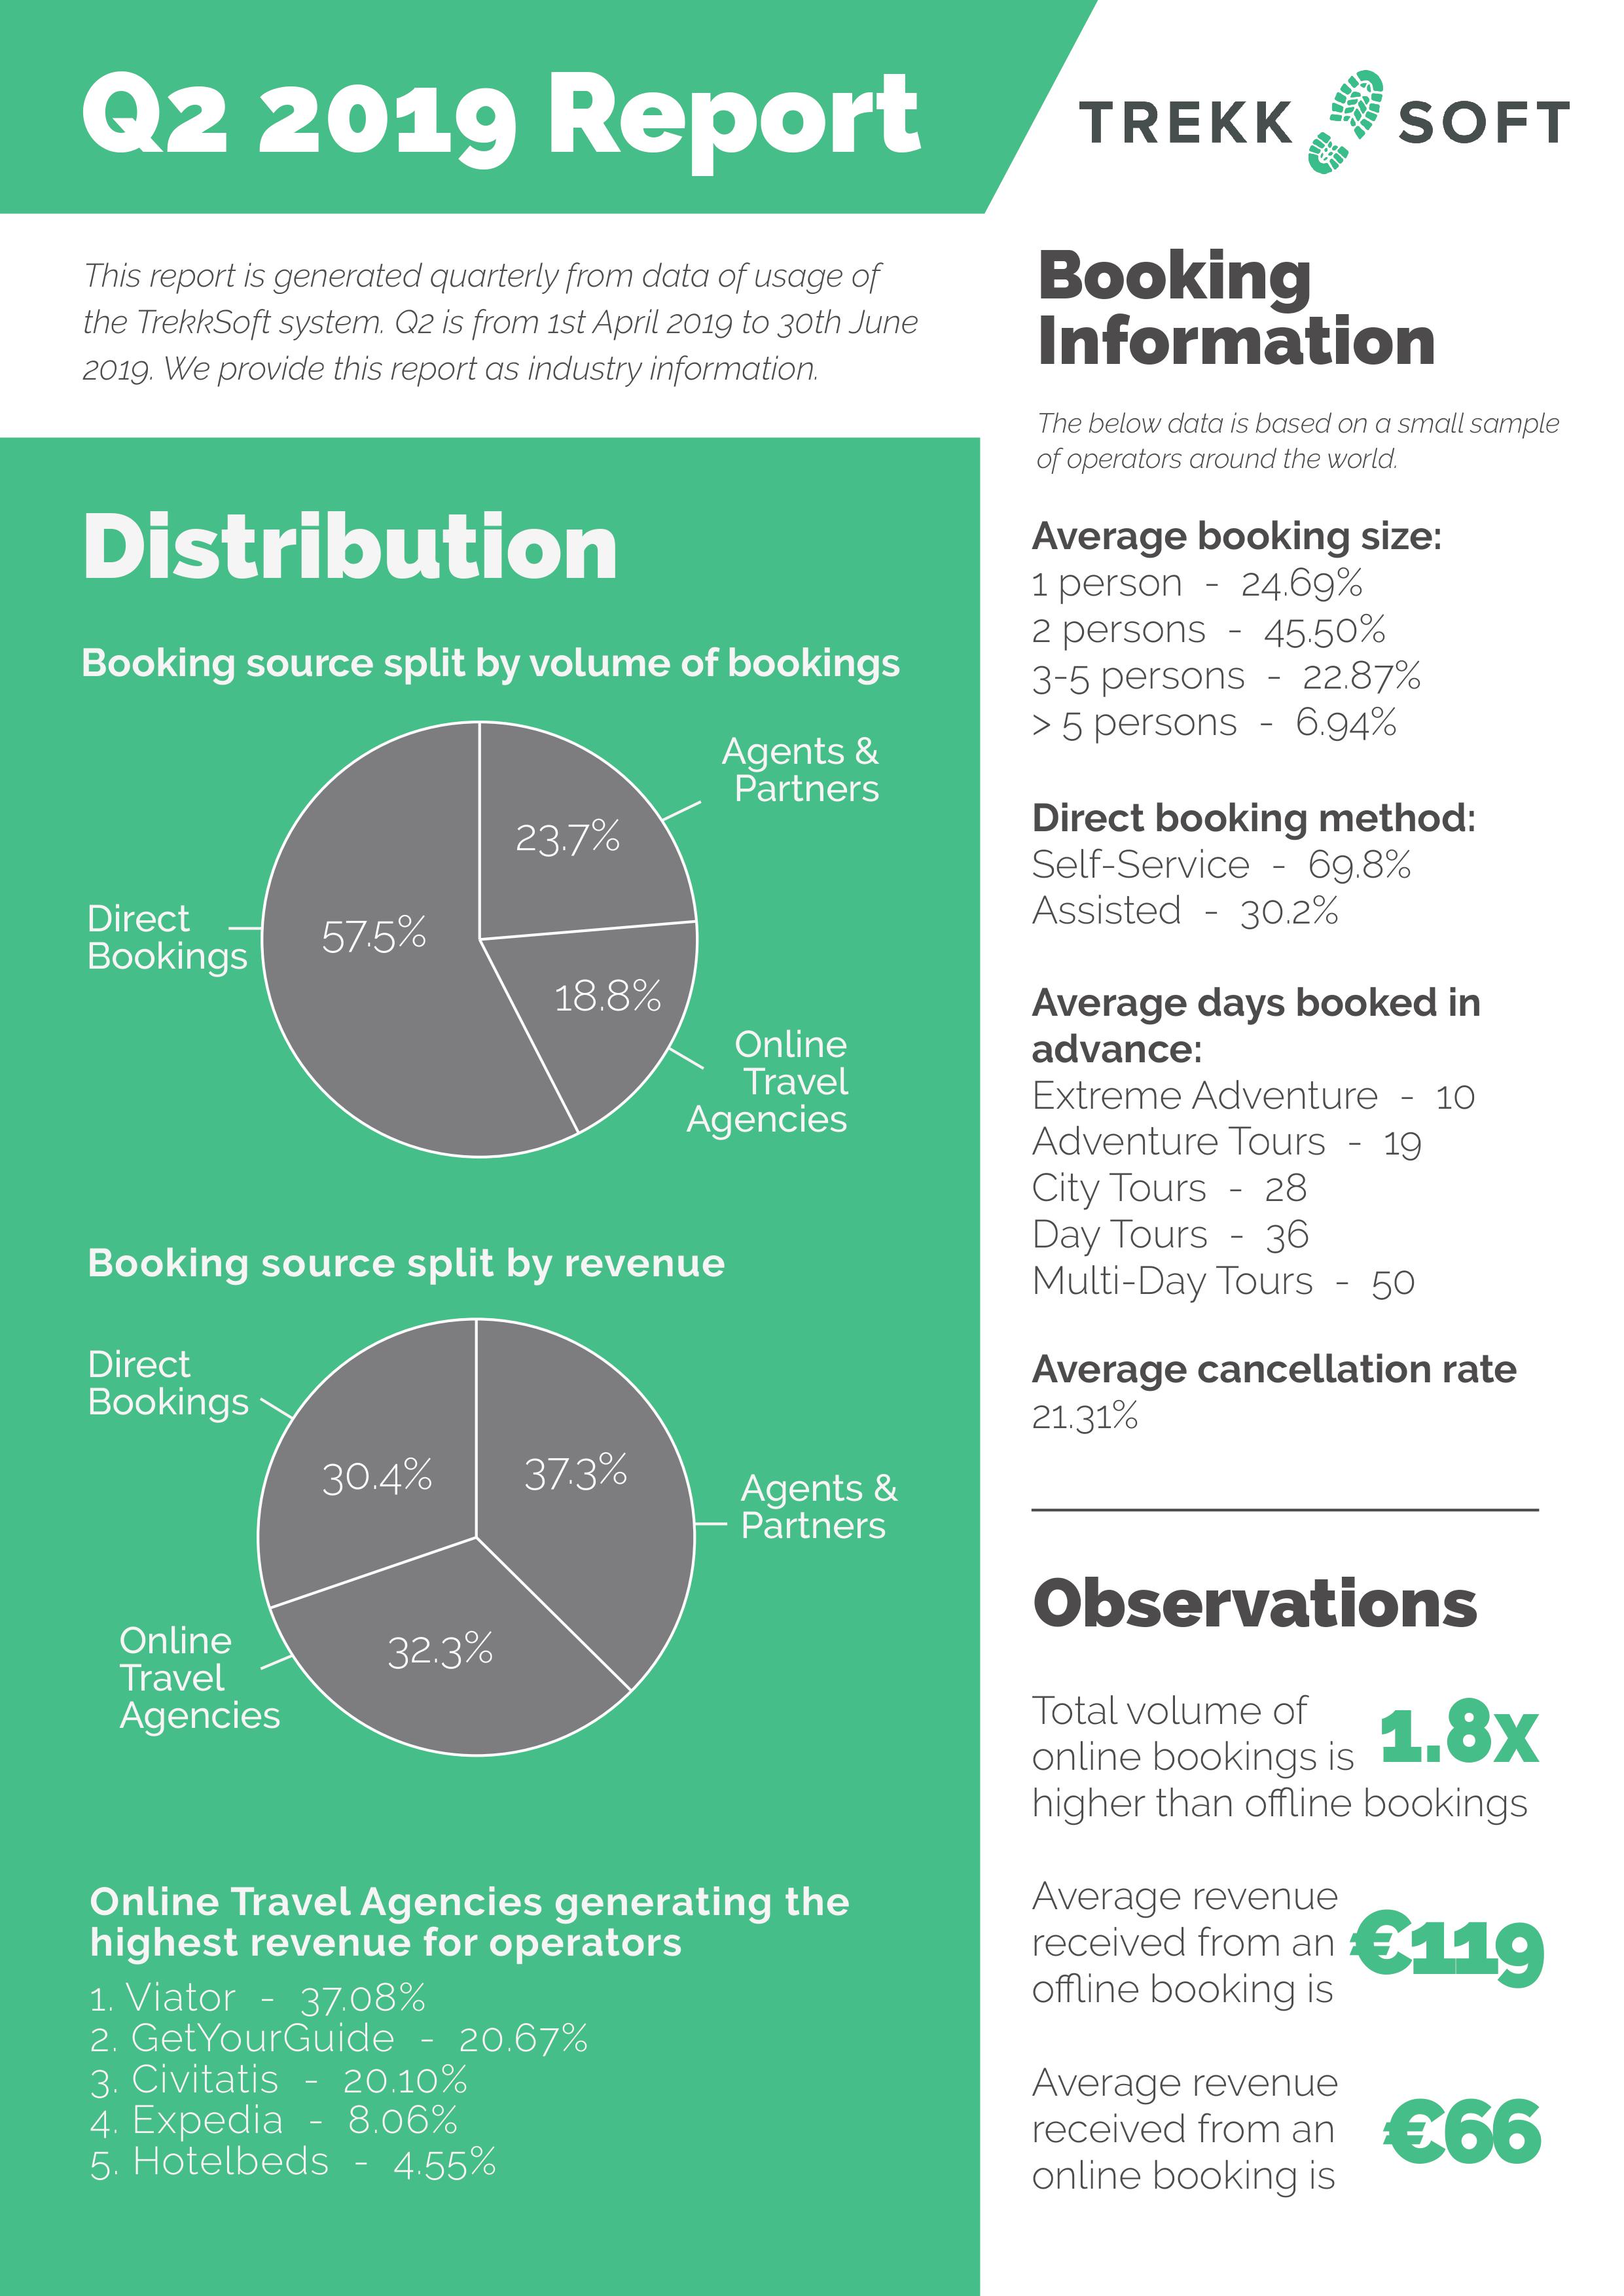
With nearly half a million bookings processed between April to June 2019, we decided to comb through our data to find the most useful insights for you.
These insights reflect both consumer booking trends in shoulder seasons, and the development of technology for the tours and activities sector.
General booking behaviour
- 40% of bookings are made for a party of 2.
- Travellers are very comfortable booking a trip for themselves, with 62% of people booking through the operator's website.
- Multi-day tours have the longest lead time of 50 days, while extreme adventure tours have the shortest lead time of just 10 days.
- On average, 1 in 5 bookings made for April to June 2019 were cancelled.
Key takeaway: Live availability has never been more important for tour suppliers. It is important for their business that travellers can book and pay directly on their website. For weather dependent activities, live availability allows operators to capture as many bookings on days with good weather to make up for losses on days with bad weather.
Click here to download the infographic
Booking channels
Online vs offline bookings
- Volume of online bookings is 1.8X higher than offline bookings.
- The average basket value of online bookings is €119 while offline bookings is worth €66. This supports our findings published in the Travel Trends Report.
- Proportion of bookings for baskets between €1 to €50 is 17% higher offline compared to online bookings. However, bookings for baskets between €100 to €500 is 13.5% higher online compared to offline. For bookings worth more than €500, a higher proportion of people book offline (6% vs 3.5%), with the assistance of the tour supplier.
Key takeaway: While online booking volume is higher, offline bookings bring in more revenue. There are two possible reasons here. One, the sales process and tour requirements for big ticket purchases tend to be more complicated, and so require the attention of a sales person either over the phone or in-person. Alternatively, it seems much easier to upsell a customer in-person compared to online channels. This highlights the need for us to develop better online booking flows to increase consumer spend.
Mobile vs desktop bookings
- Reservations on mobile are 2X higher than on any other booking channel
- Average and median booking value from desktop bookings is 37% higher than bookings made on mobile.
Key takeaway: People are more comfortable making a reservation on mobile rather than making a booking and payment. For those who choose to make payments via mobile, they tend to make payments for tours with a lower price tag. This might reflect consumer confidence in mobile sites of operators or the user experience on mobile, offering a lot of room for improvement. Alternatively, the customer segment that is likely to book on mobile might be one that is price conscious and on-the-go, like backpackers for example.
Distribution channels
- On average, direct channels bring in the highest volume of bookings (57.5%), followed by agents (23.7%) and OTAs (18.8%). However, revenue from direct channels only make up 30% of total revenue. Agents bring in the largest portion of revenue before commission, at 37.3%, followed by OTAs at 32.3%.
- The average basket value of direct bookings is €42 while the average booking value from OTAs is more than 3X higher at €136. Agents and partners bring in bookings valued at €125.
- As of June 2019, TripAdvisor Experiences (Viator) was the top distributor for tours and activities.
Key takeaway: It is concerning that on average, our customers are making less than 50% of revenue from their direct channels. For businesses to thrive in the long run, we recommend that a majority of bookings and revenue come from direct channels. Operators should find ways to reach customers directly, especially if these customers are local or already in-destination.
Get the report here:


